What is Redistricting?
Every ten years, local governments use new census data to redraw district lines to reflect how local populations have changed. The goal of redistricting is to balance the population between commission districts. Redistricting is accomplished by adjusting the boundaries of Lee County's five at-large commission districts to account for population growth.
On this page, you will find important dates, maps, useful information and tools to better understand how the process works.
Updated October 26, 2021
Redistricting Report contains map alternatives 1 through 7.
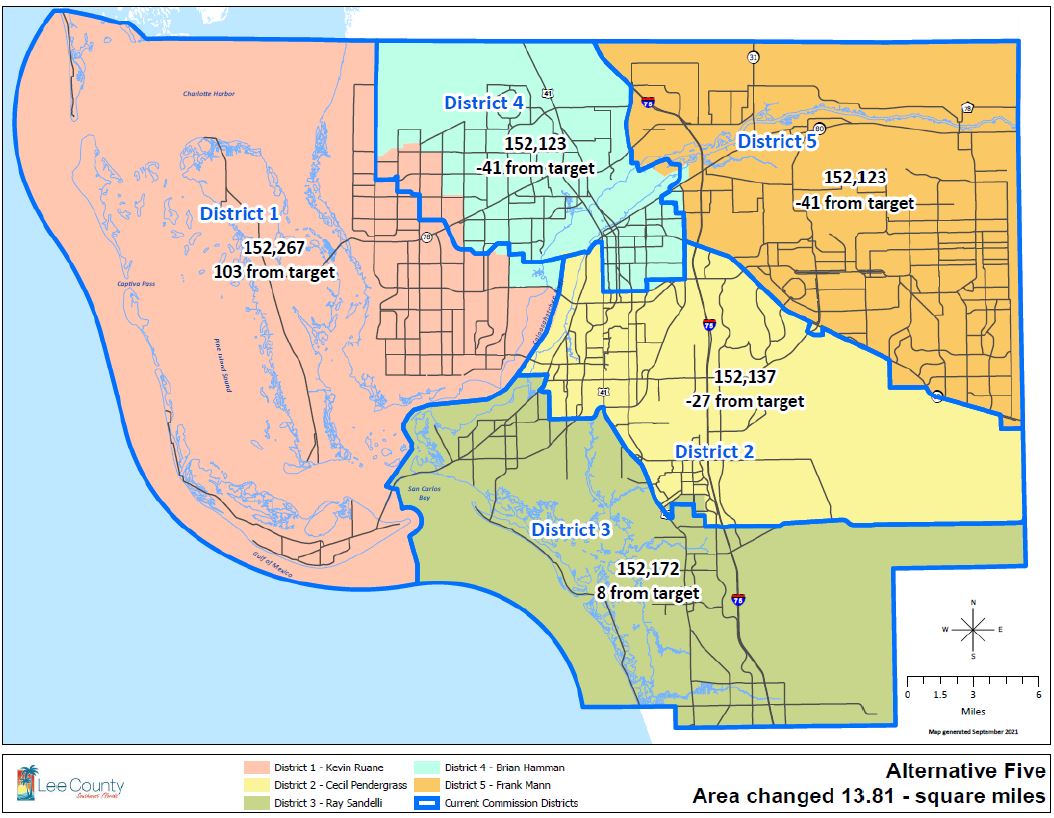
On November 2, 2021 the Lee Board of County Commissioners directed Map Alternative 5 to be published for adoption consideration on November 16, 2021.
Public Meetings
Meeting location: Old Lee County Courthouse, 2120 Main Street, Fort Myers, FL 33901
Stream video of Board meetings on LeeTV, Youtube, or Facebook Live.
RESOURCES
REDISTRICTING TIMELINE
The data from the 2020 Census was released by the Census Bureau later in the year than in previous years due to the COVID-19 pandemic. Redistricting, which is to be considered in odd-numbered years, is a process that normally takes ten months. The delay in releasing the data has condensed this process to approximately four months. The following schedule reflects Lee County's intended timeline to complete the process.
September 2021
- Review 2020 data
- Examine need to redistrict
- Prepare initial map options
Current Map & Map Alternatives
This map shows how the current commission districts are drawn. It also includes the population statistics from 2010 and 2020 to show the growth within the boundaries as they are currently drawn. The change in population from 2010 to 2020 is what makes the redistricting process necessary. The process will rebalance the population for each district.
|
| Each of these
maps indicate the ways the boundaries could be redrawn to balance the population for each district. These options are reviewed by the commissioners and the public, who can submit their input and possible alternative maps. This process is key to selecting the map that will balance the population most fairly. |
|
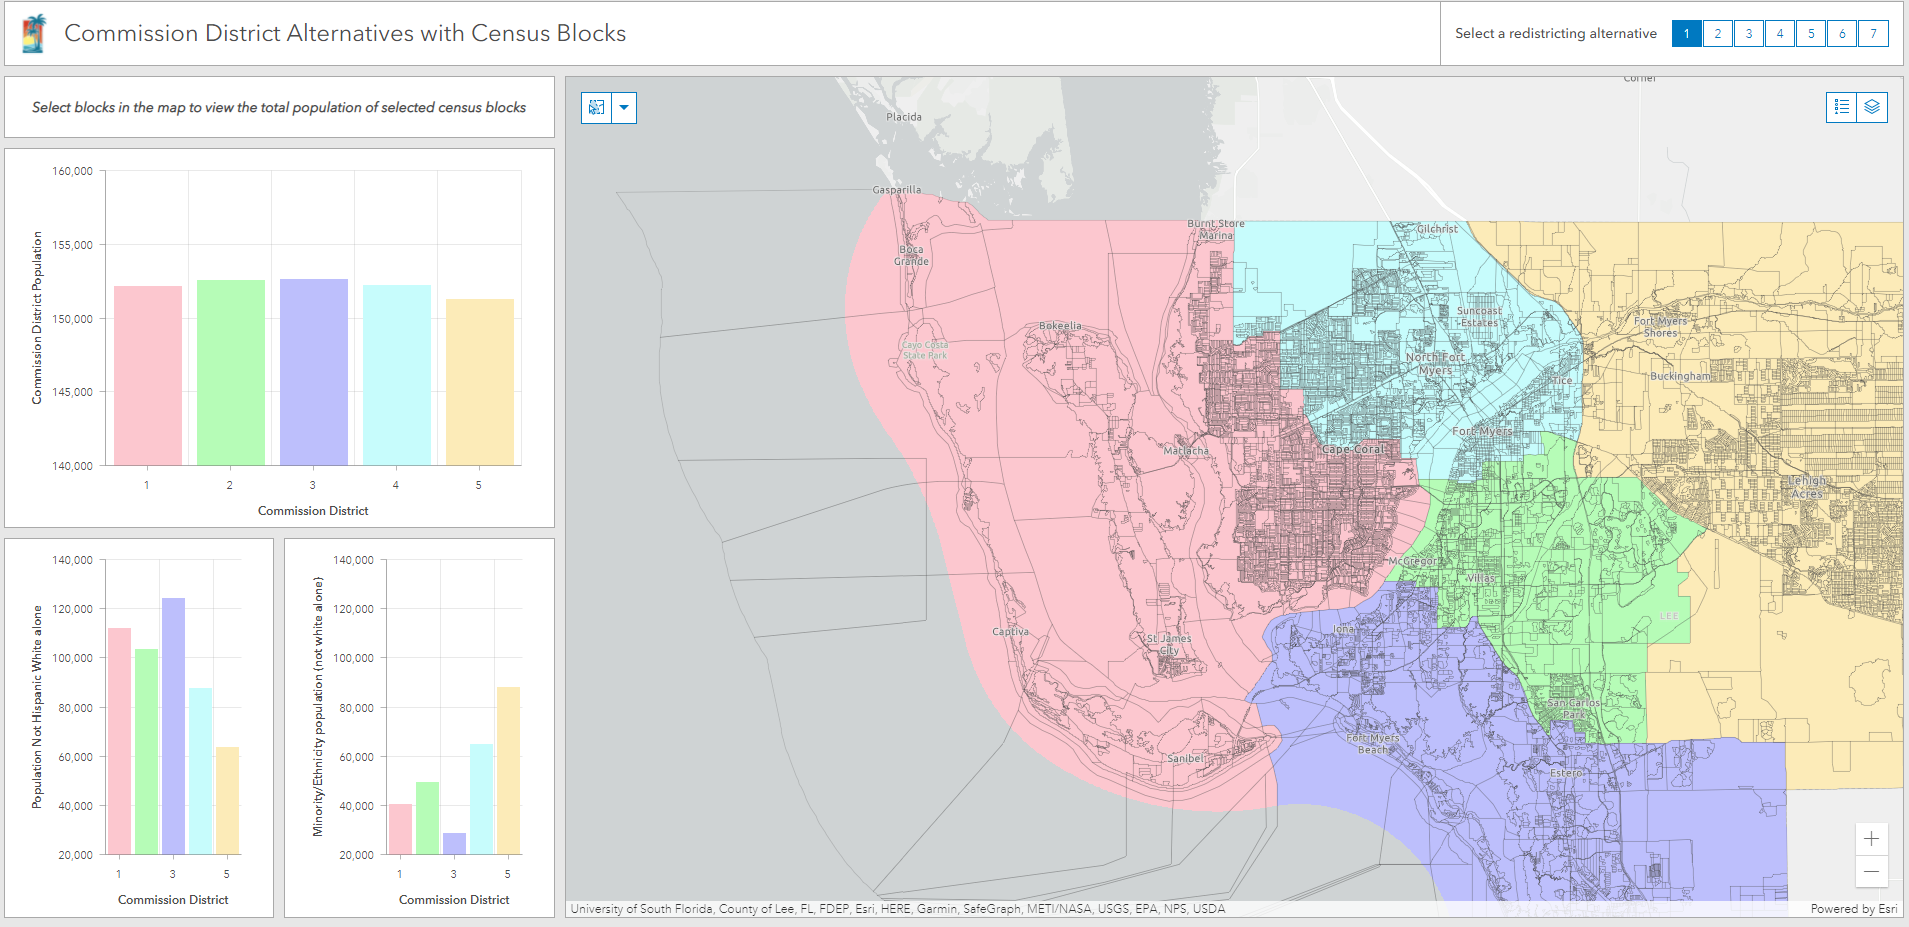
Interactive Map
|
This resource provides you with the ability to zoom in to street level to see exactly where the proposed boundaries will be. This map includes alternative options 1-5,6(C), and 7.
|
Census Demographics
|
Target 152,164
| District 1
| District 2
| District 3
| District 4
| District 5
| Current District
| Population
| 144,126
| 160,138
| 146,619
| 152,571
| 157,368
| Difference from Target
| -8,038
| 7,974
| -5,545
| 407
| 5,204
| % Deviation from Target
| -5.28%
| 5.24%
| -3.64%
| 0.27%
| 3.42%
|
|
|
2020 Population
|
Percent of Total 2020 Population
|
2010 Population
|
2010-2020 Percent Change
|
Race
| Total
| 760,822
| 100%
| 618,754
| 23.0%
| White Alone
| 530,637
| 69.7%
| 513,496
| 3.3%
| Black Alone
| 58,916
| 7.7%
| 51,069
| 15.4%
| American Indian & Alaska Native Alone
| 3,828
| 0.5%
| 2,193
| 74.6%
| Asian Alone
| 13,090
| 1.7%
| 8,461
| 54.7%
| Native Hawaiian or Other Pacific Islander Alone
| 312
| 0.0%
| 380
| -17.9%
| Some Other Race Alone
| 56,861
| 7.5%
| 30,290
| 87.7%
| 2 or More Races
| 96,178
| 12.8%
| 12,865
| 655.4%
|
Ethnicity
| Hispanic or Latino
| 173,161
| 22.8%
| 113,308
| 52.8%
| Not Hispanic or Latino
| 587,661
| 77.2%
| 505,446
| 16.3%
| Source: U.S. Census Bureau, Census 2020 and 2010 Redistricting Data (Public Law 94-171).
Notes:
1. Percent figures are rounded. 2. Hispanic or Latino population may be of any race. 3. Responses provided on the decennial Census questionnaire are self-reported, include identification of Race; each individual completing the Census form identifies the race of all persons in the residence. While it cannot be known with certainty what each individual means in selection the "Some Other Race" category, Census Bureau testing and research offers some insight. For Example, some persons that self-identify as "Some Other Race" are of Hispanic or Latino ethnicities thus appear to view that ethnicity as a race, while the others may self-identify race based upon their country or region of origin, e.g. White Irish instead of White.
|
|
COUNTY, STATE & FEDERAL REDISTRICTING RESOURCES
Language Translations
Please use Google Chrome as the internet browser to view this page. Use the translator in the upper right of the page to select the language of your choice. Lee County will provide translated documents at no charge to you.
Español: Por favor use el navegador de Internet Google Chrome para ver esta página. Use el traductor en la parte superior derecha de la página para seleccionar el idioma que prefiera. El Condado de Lee le proporcionará documentos traducidos sin costo para usted.
Haitian Creole: Tanpri itilize navigatè Entènèt Google Chrome nan pou wè paj sa a. Itilize tradiktè ki anwo adwat paj la pou chwazi lang ou prefere a. Konte Lee pral ofri dokiman ki tradui san sa pa koute w anyen.
ADA Accommodations
Lee County will generally, upon request, provide appropriate aids and services leading to effective communication for qualified persons with disabilities so they can participate equally in the County's programs, services and activities, including qualified sign language interpreters, documents in Braille, and other ways of making information and communications accessible to people who have speech, hearing or vision impairments.
Anyone who requires an auxiliary aid or service for effective communication, or a modification of policies or procedures to participate in a County program, service or activity, should contact Joan LaGuardia at 239-533-2314, Florida Relay Service 711, or
ADArequests@leegov.com, as soon as possible but no later than five (5) business days before the scheduled event.
If you are in person at a meeting, please ask a staff member for assistance.